World Congress on Medical Physics and Biomedical Engineering, 2018
Brain Tumor Classification Using Convolutional Neural Network
Volume 1, pp. 183–189. Springer Singapore.
Part of CNN-based Brain Tumor Classifier
@inproceedings{abiwinanda2019brain,
  title     = {Brain tumor classification using convolutional neural network},
  author    = {Abiwinanda, Nyoman and Hanif, Muhammad and Hesaputra, S. Tafwida and Handayani, Astri and Mengko, Tati Rajab},
  booktitle = {World Congress on Medical Physics and Biomedical Engineering 2018},
  volume    = {1},
  pages     = {183--189},
  year      = {2019},
  publisher = {Springer Singapore}
}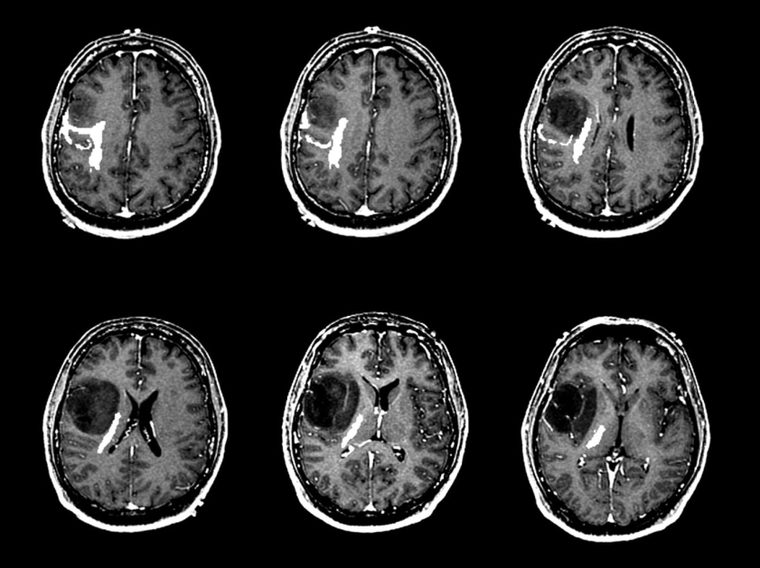
Getting the type of a brain tumour wrong delays the right intervention, and the conventional route to getting it right — inspecting a patient’s MRI images by eye, at volume — is slow and prone to human error. Automated pipelines existed, but nearly all of them shared one step: segment the tumour mass first, then extract features from the segmented region, then classify.
This paper asked what happens if you skip the segmentation entirely.
Method
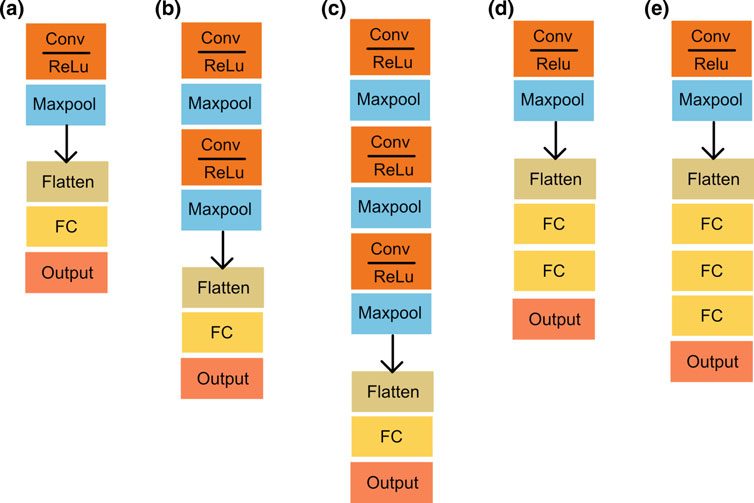
Five CNN architectures, all deliberately far simpler than AlexNet, VGG16 or ResNet. The hyperparameters — filter count and size, pooling kernel, neurons per fully-connected layer — were held fixed, and only depth varied between them, so the comparison isolates one thing.
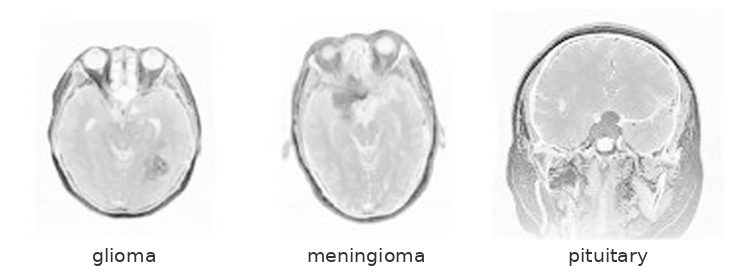
Classes were balanced by taking 700 images each (500 train, 200 validation) rather than using the native 708/1426/930 split. Images were downscaled from 512 × 512 to 64 × 64, which was a concession to training without a GPU.
Results
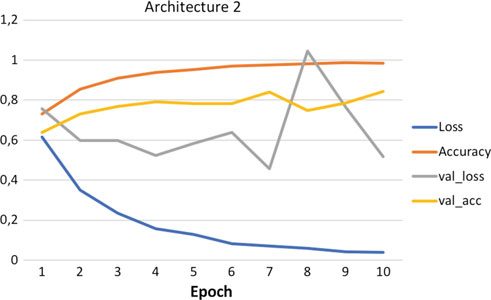
Architecture 2 won — two convolution/ReLU/maxpool blocks followed by a single 64-neuron hidden layer. It reached 98.51% training and 84.19% validation accuracy.
It won for a reason worth stating precisely: it was the only one of the five whose validation loss decreased consistently across epochs. Every other architecture showed validation loss trending upward while training accuracy climbed — textbook overfitting, and a reminder that on a dataset this size the accuracy number alone tells you very little.
Widening the winning architecture to 64 and 128 filters — architectures 6 and 7 — did not beat it at
- More capacity was not the constraint.
Why it matters
84.19% sits inside the 71.39–94.68% band reported for conventional region-based methods on the same dataset, while needing no segmentation step at all. For a dataset of a few thousand images, a three-layer network with no preprocessing is competitive with pipelines that require the tumour to be found before it can be classified.
Carried out at the Biomedical Research Group, Bandung Institute of Technology.